Analysis of feed cost and benefit of raising cattle
Date: 06/12/2020 08:11:49 From: feed-pellet-plant.com Clicks:
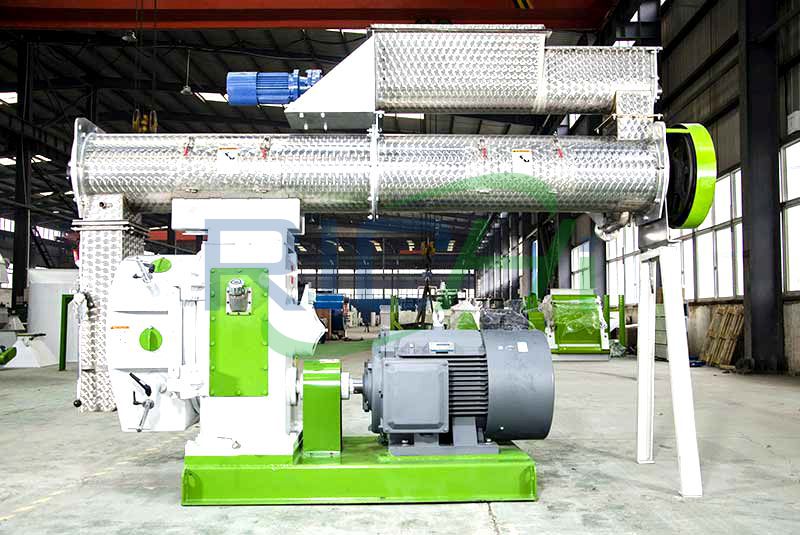
cattle feed plant costing: revenue and feed cost. How do cattle farms account for feed costs and benefits? Small cattle farms generally buy feed pellets from feed pellet suppliers, while large cattle farms will buy feed pellet machines or cattle feed pellet production lines themselves, which can greatly reduce the cost of feed for cattle breeding. Below is analysis of feed cost and benefit of raising cattle.
Analysis of feed cost and benefit of raising cattle
1. Feeding Cost of Gain
Figure 1 illustrates feeding cost of gain from January 2009 to December 2018. Feeding cost of gain information was obtained from monthly issues of the Focus on Feedlots newsletter (here). Feeding cost of gain averaged $78.10 per cwt. in 2018 ranging from a low of $74.87 in May to a high of $80.31 in December. Given current corn and alfalfa price projections, feeding cost of gain is expected to range from $79 to $82 during the first 6 months of 2019.
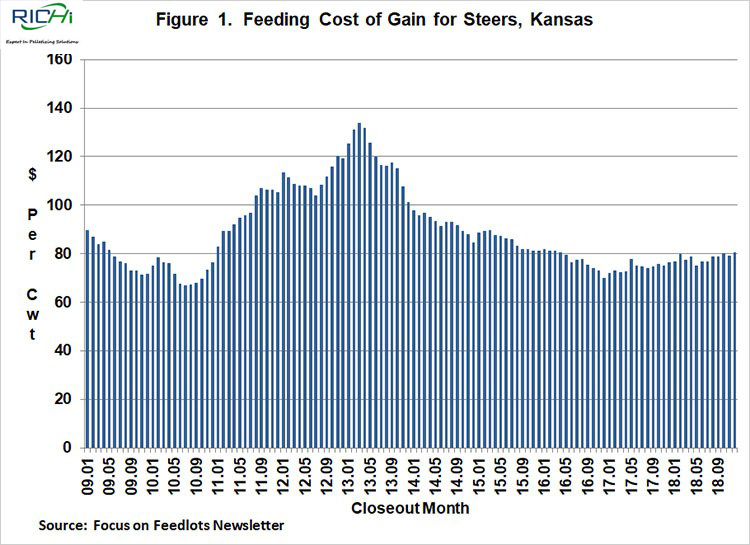
Figure 1. Feeding Cost of Gain for Steers, Kansas
Feeding cost of gain is sensitive to changes in feed conversions, corn prices, and alfalfa prices. Regression analysis using data for the last ten years was utilized to examine the relationship between feeding cost of gain, and feed conversion, corn prices, and alfalfa prices.
Results are as follows: each 0.10 increase in feed conversion increases feeding cost of gain by $1.43 per cwt., each $0.10 per bushel increase in corn prices increases feeding cost of gain by $0.87 per cwt., and each $5 per ton increase in alfalfa prices increases feeding cost of gain by $0.55 per cwt.
2. Feeder to Fed Price Ratio
The ratio of feeder to fed cattle prices for the last ten years is illustrated in Figure 2. Feeder cattle and fed cattle prices were obtained from the Livestock Marketing Information Center. During the ten-year period, this ratio averaged 1.20. The feeder to fed price ratio was one standard deviation below (above) this average for 13 (18) months during the ten-year period.
The average net return for the months in which the ratio was below one standard deviation of the average was $159 per head. In contrast, the average loss for the months in which the ratio was above one standard deviation was $238 per head. The average ratio for the 18 months with a feeder to fed price ratio that was above one standard deviation of the ten-year average was 1.47.
Given current price projections, the feeder to fed price ratio is not expected to reach these levels. However, the projected ratio is expected to remain above the ten-year average for most of 2019, with the exception being June.
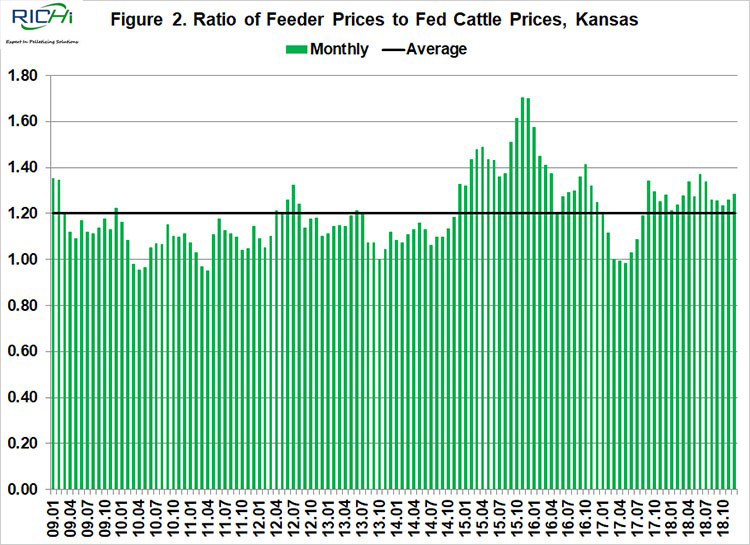
Figure 2. Ratio of Feeder Prices to Fed Cattle Prices, Kansas
As cattle feeders well know, if cattle are not purchased at the “right price”, losses will incur. Given the uncertainty in fed cattle prices, this is easier said than done. The strong correlation coefficient between cattle finishing net returns and the feeder to fed cattle price ratio almost guarantees that losses will occur when this ratio is relatively high.
3. Cattle Finishing Net Returns
Monthly cattle finishing net returns from January 2009 to December 2018 are presented in Figure 3. It is important to note that net returns were computed using closeout months rather than placement months. Several data sources were used to compute net returns. Average daily gain, feed conversion, days on feed, in weight, out weight, and feeding cost of gain were obtained from the Focus on Feedlots newsletter, feeder cattle and fed cattle prices from the Livestock Marketing Information Center, and interest rates from the Federal Reserve Bank of Kansas City.
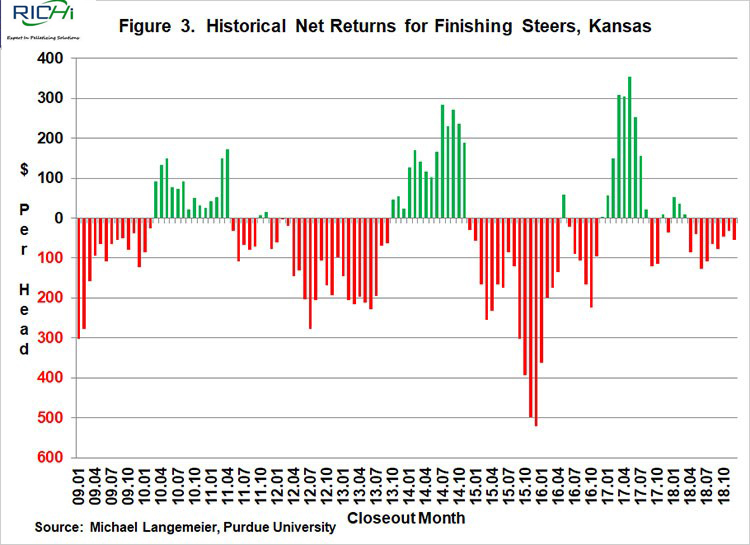
Figure 3. Historical Net Returns for Finishing Steers, Kansas
Net returns averaged $111 per head in 2017 and a negative $45 per head in 2018. Historical and breakeven prices for the last ten years, as well as projected breakeven prices for 2019 are illustrated in Figure 4. Breakeven prices in the first 4 months of 2019 are expected to range from $124 to $127 per cwt. Breakeven prices for the rest of the year are expected to range from $117 to $121.
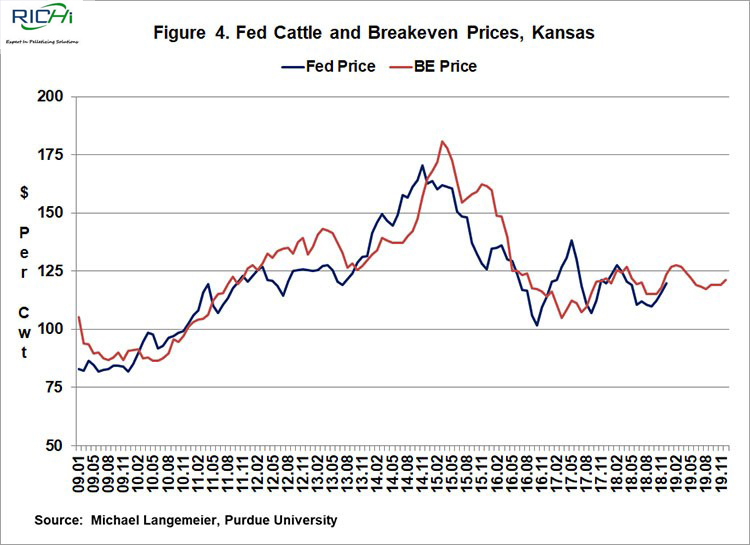
Figure 4. Fed Cattle and Breakeven Prices, Kansas
Correlation coefficients can be used to examine the relationship between net returns, feeding cost of gain, and the feeder to fed cattle price ratio. Correlation is a statistical measure of how variables move together and is bounded by -1.0 and 1.0. A value of -1.0 indicates two variables move together perfectly, but in opposite directions, while a value of 1.0 indicates two variables move up and down together proportionally. Values close to zero indicate two variables have little relationship to each other.
Net returns are significant and negatively correlated with feeding cost of gain (r = -0.230) and the feeder to fed cattle price ratio (r = -0.758). The strong correlation between net returns and the feeder to fed cattle ratio emphasizes the importance of purchasing feeders at the “right price”.
Cattle finishing net returns are sensitive to changes in feeding cost of gain and the feeder to fed cattle price ratio. Regression analysis using data for the last ten years was utilized to examine the relationship between these variables. Results are as follows: each $1 increase in feeding cost of gain results in a decrease in cattle finishing net returns of $3.70 per head, and each 1 percent increase in the feeder to fed cattle price ratio results in a decrease of $8.63 per head in cattle finishing net returns.
Using relationships between corn prices, feeding cost of gain, and cattle finishing net returns; a $0.10 increase in corn prices, holding all else constant, would result in a decrease in cattle finishing net returns of approximately $3.20 per head. Similarly, a $10 increase in alfalfa prices would result in a decrease in cattle finishing net returns of approximately $4.05 per head.
Summary and Conclusions
This article examined the impact of changes in corn and alfalfa prices on feeding cost of gain and cattle finishing net returns. Each $0.10 increase in corn price results in a decrease in feeding cost of gain of approximately $0.87 per cwt. and a decrease in net returns of approximately $3.20 per head. Each $10 increase in alfalfa prices results in a $1.10 per cwt. decrease in feeding cost of gain and a decrease of $4.05 per head in net returns.
The impact of changes in corn and alfalfa prices on cattle finishing net returns may seem small to some industry observers. It is important note that the impact of changes in corn and alfalfa prices on cattle finishing net returns is dampened by the fact that lower (higher) feed prices typically increase (decrease) feeder prices. These relatively higher feeder prices adversely impact cattle finishing net returns.
Related Case
3-4T/H Ruminant Animal Feed Pellet Line Export To Hong Kong,China
3-5T/H Ruminant Animal Feed Pellet Line Export To Indonesia
5-6T/H Cattle Feed+10T/H Chicken Feed Pellet Production Line Export To Saudi Arabia
10T/H Ruminant Feed Pellet Line Export To South Africa
Related Case
3-4T/H Ruminant Animal Feed Pellet Line Export To Hong Kong,China
3-5T/H Ruminant Animal Feed Pellet Line Export To Indonesia
5-6T/H Cattle Feed+10T/H Chicken Feed Pellet Production Line Export To Saudi Arabia
10T/H Ruminant Feed Pellet Line Export To South Africa
The above is the article for you: Analysis of feed cost and benefit of raising cattle. If you are interested in our products or project solutions, please contact us. We will give you the best product quality and the best price. Email: enquiry@pellet-richi.com
Related Product
Production Line Equipment
related News
- >Analysis of Cost, Income and Economic Benefits of Large-scale Shee
- >Investment Analysis of 5000 Tons/year Forage Grass Feed Pellet Pro
- >Investment Benefit Analysis of Cattle and Sheep Feed Pellets Produ
- >Analysis of Pennisetum Hydridum Pellet Production Project
- >2020 Market Analysis Report on Poultry Breeding Projects
- >2020 Livestock Project Market Analysis Report
- >How to Reduce Feed Costs for Large Dairy Cow Plant
- >The Benefits of Feeding Lucerne Alfalfa to Dairy Cows
- >How to Reduce Feed Cost in Cattle Industry
- >How To Strictly Control Feed Cost For Cattle Raising Enterprises
Here you can submit any questions and we will get back to you as soon as possible. We will not disclose the information you submit to anyone, please rest assured.
Copyright© 2022 Richi Machinery. All rights reserved. Site Map
 Product Center
 Get Latest Price